Structural Engineering, Engagement, and Equity
  • Events
    • Past Events >
      • 2025 SE3 Symposium >
        • Program Overview
        • Program Deep Dive
        • Symposium Planning Team
      • 2025 January Association Meeting
      • 2025 Navigating a Career as a Non-US Citizen
      • 2024 Fostering Racial Equity
      • 2024 Parenting Charrette
      • 2024 Celebration of Women in Structural Engineering
      • 2023 Long-Term Mentorship Program
      • 2022 SE3 Symposium Recap >
        • Thought Leaders
        • FAQ
        • Symposium Link Tree
      • 2019 SE3 Symposium Recap
      • 2017 SE3 Symposium Recap
  • Contributors
    • Past SE3 Committee Contributors
  • Publications & Best Practices
    • SEAONC SE3 DEIB Database
    • SEAONC SE3 Publications
    • NCSEA SE3 Publications
    • Monthly DEI Spotlight
    • SE3's Commitment to Racial Justice
  • News
  • Contact Us
  • Blog
SURVEY DEMOGRAPHICS

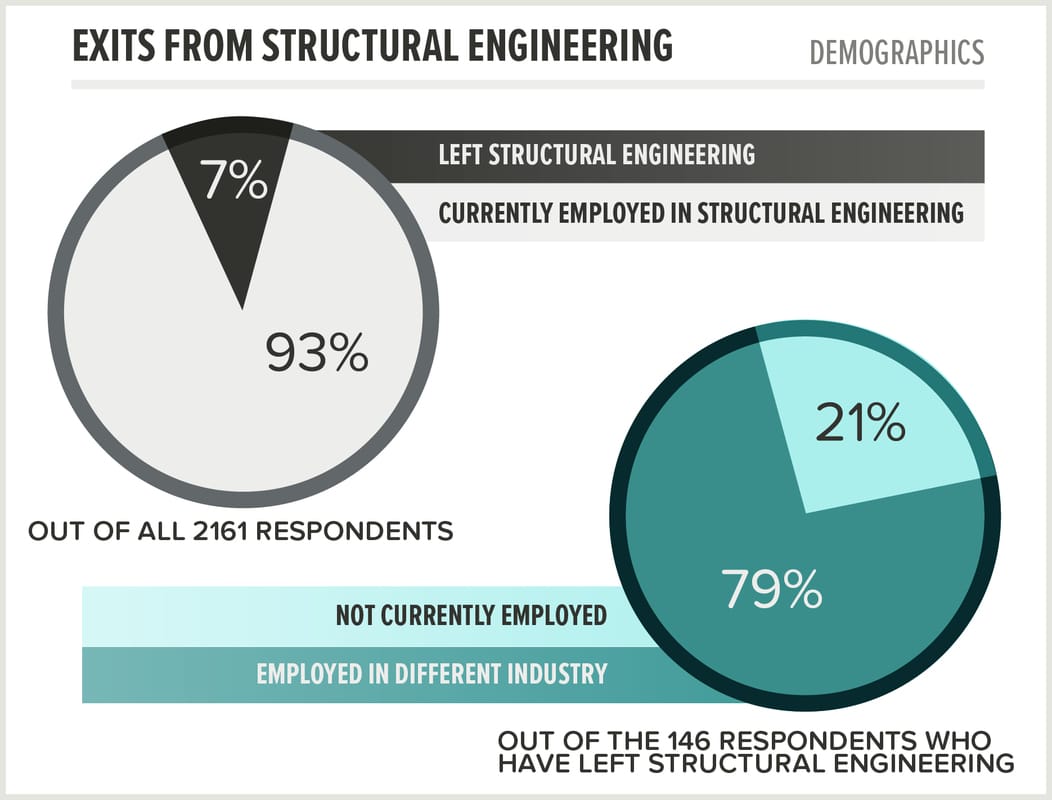
Exits - Former Structural Engineers
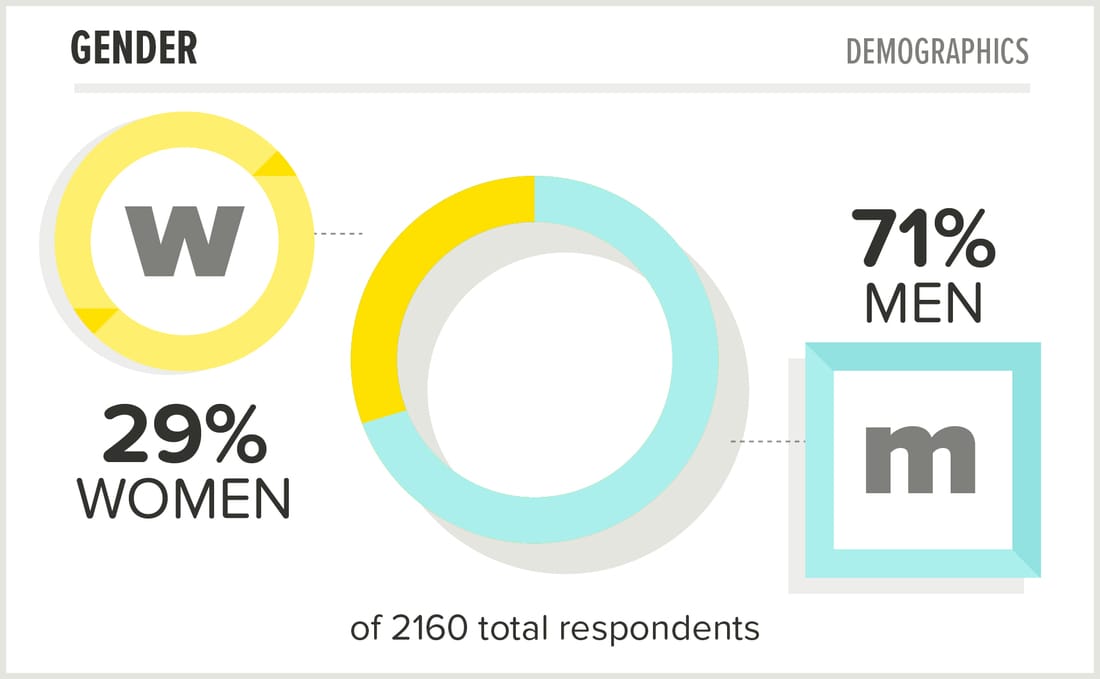
Of the 2,161 we surveyed, approximately 93% are currently practicing structural engineers, and 7% are people who have left the profession (aka "Exits"). We surveyed 146 Exits, of which approximately 79% are currently working in a different industry, and 21% are not currently employed. ​
Picture
Picture

Age

The figure at left illustrates the age distribution of our survey respondents. Almost half of our responses came from individuals under the age of 35, and the number of responses in each successive age group is less. 

Gender

29% of our survey respondents are women, and 71% are men.
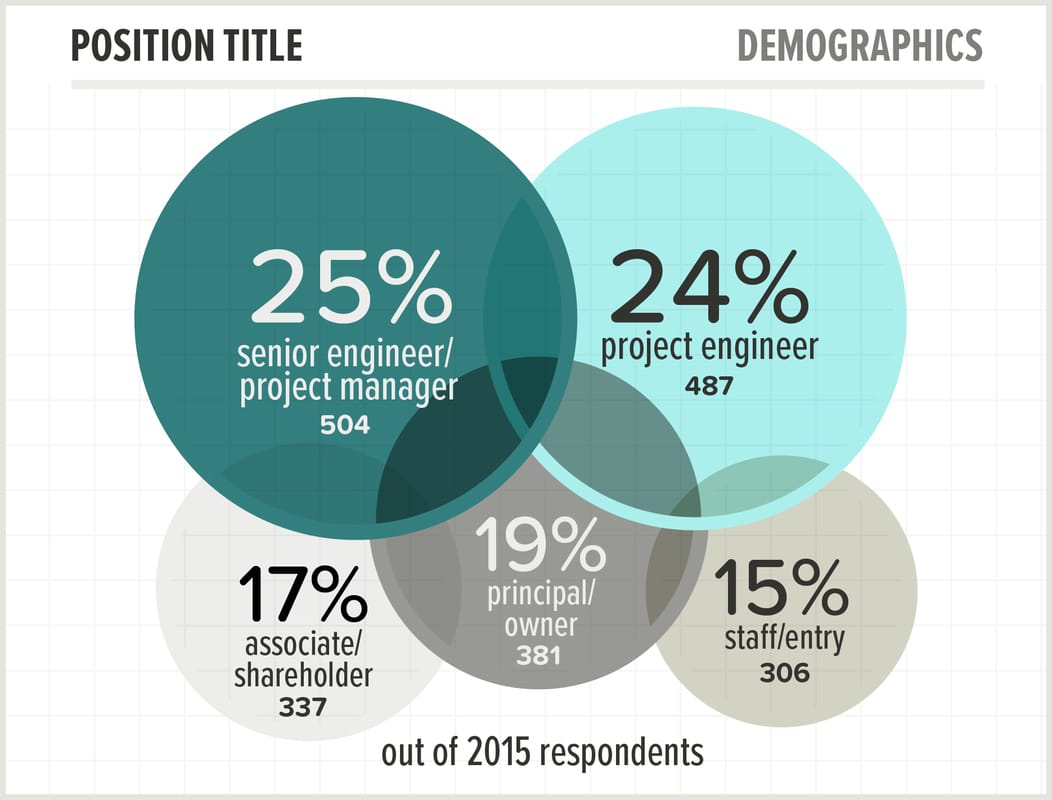
Picture
Picture

Position Title

Survey takers indicated one of five job position levels. Because job titles vary significantly at SE firms, a description of tasks and responsibilities was provided for each position level. About one-quarter of our survey respondents indicated that they are at project engineer or senior project manager level, but we also received a large number (381) of responses at the principal level. 
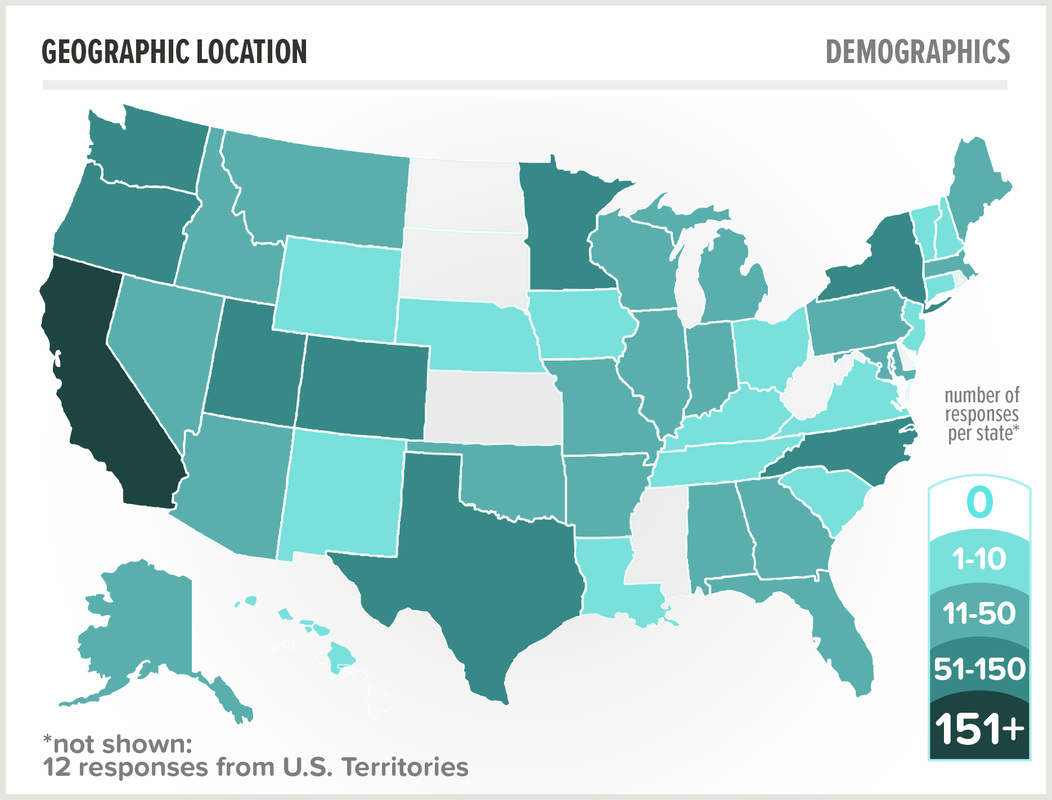
Geographic Location

Over half of our responses (1,000+) came from within CA State. The number of responses from the next largest set of states was between 50-150 each. 
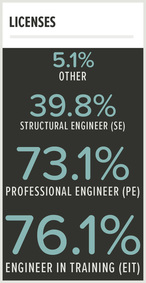
Picture
Picture
Picture

Licenses and Degrees

73% of survey respondents have a PE license and almost 40% have an SE. 

74% of survey respondents have a bachelors degree in civil/structural engineering. 62% have a masters degree in civil/structural, and 3.5% have a Ph.D. in civil/structural.
  • Events
    • Past Events >
      • 2025 SE3 Symposium >
        • Program Overview
        • Program Deep Dive
        • Symposium Planning Team
      • 2025 January Association Meeting
      • 2025 Navigating a Career as a Non-US Citizen
      • 2024 Fostering Racial Equity
      • 2024 Parenting Charrette
      • 2024 Celebration of Women in Structural Engineering
      • 2023 Long-Term Mentorship Program
      • 2022 SE3 Symposium Recap >
        • Thought Leaders
        • FAQ
        • Symposium Link Tree
      • 2019 SE3 Symposium Recap
      • 2017 SE3 Symposium Recap
  • Contributors
    • Past SE3 Committee Contributors
  • Publications & Best Practices
    • SEAONC SE3 DEIB Database
    • SEAONC SE3 Publications
    • NCSEA SE3 Publications
    • Monthly DEI Spotlight
    • SE3's Commitment to Racial Justice
  • News
  • Contact Us
  • Blog